Repository navigation
Expand file tree
/
Copy pathREADME.Rmd
More file actions
1240 lines (800 loc) · 39 KB
/
Copy pathREADME.Rmd
File metadata and controls
1240 lines (800 loc) · 39 KB
1
2
3
4
5
6
7
8
9
10
11
12
13
14
15
16
17
18
19
20
21
22
23
24
25
26
27
28
29
30
31
32
33
34
35
36
37
38
39
40
41
42
43
44
45
46
47
48
49
50
51
52
53
54
55
56
57
58
59
60
61
62
63
64
65
66
67
68
69
70
71
72
73
74
75
76
77
78
79
80
81
82
83
84
85
86
87
88
89
90
91
92
93
94
95
96
97
98
99
100
101
102
103
104
105
106
107
108
109
110
111
112
113
114
115
116
117
118
119
120
121
122
123
124
125
126
127
128
129
130
131
132
133
134
135
136
137
138
139
140
141
142
143
144
145
146
147
148
149
150
151
152
153
154
155
156
157
158
159
160
161
162
163
164
165
166
167
168
169
170
171
172
173
174
175
176
177
178
179
180
181
182
183
184
185
186
187
188
189
190
191
192
193
194
195
196
197
198
199
200
201
202
203
204
205
206
207
208
209
210
211
212
213
214
215
216
217
218
219
220
221
222
223
224
225
226
227
228
229
230
231
232
233
234
235
236
237
238
239
240
241
242
243
244
245
246
247
248
249
250
251
252
253
254
255
256
257
258
259
260
261
262
263
264
265
266
267
268
269
270
271
272
273
274
275
276
277
278
279
280
281
282
283
284
285
286
287
288
289
290
291
292
293
294
295
296
297
298
299
300
301
302
303
304
305
306
307
308
309
310
311
312
313
314
315
316
317
318
319
320
321
322
323
324
325
326
327
328
329
330
331
332
333
334
335
336
337
338
339
340
341
342
343
344
345
346
347
348
349
350
351
352
353
354
355
356
357
358
359
360
361
362
363
364
365
366
367
368
369
370
371
372
373
374
375
376
377
378
379
380
381
382
383
384
385
386
387
388
389
390
391
392
393
394
395
396
397
398
399
400
401
402
403
404
405
406
407
408
409
410
411
412
413
414
415
416
417
418
419
420
421
422
423
424
425
426
427
428
429
430
431
432
433
434
435
436
437
438
439
440
441
442
443
444
445
446
447
448
449
450
451
452
453
454
455
456
457
458
459
460
461
462
463
464
465
466
467
468
469
470
471
472
473
474
475
476
477
478
479
480
481
482
483
484
485
486
487
488
489
490
491
492
493
494
495
496
497
498
499
500
501
502
503
504
505
506
507
508
509
510
511
512
513
514
515
516
517
518
519
520
521
522
523
524
525
526
527
528
529
530
531
532
533
534
535
536
537
538
539
540
541
542
543
544
545
546
547
548
549
550
551
552
553
554
555
556
557
558
559
560
561
562
563
564
565
566
567
568
569
570
571
572
573
574
575
576
577
578
579
580
581
582
583
584
585
586
587
588
589
590
591
592
593
594
595
596
597
598
599
600
601
602
603
604
605
606
607
608
609
610
611
612
613
614
615
616
617
618
619
620
621
622
623
624
625
626
627
628
629
630
631
632
633
634
635
636
637
638
639
640
641
642
643
644
645
646
647
648
649
650
651
652
653
654
655
656
657
658
659
660
661
662
663
664
665
666
667
668
669
670
671
672
673
674
675
676
677
678
679
680
681
682
683
684
685
686
687
688
689
690
691
692
693
694
695
696
697
698
699
700
701
702
703
704
705
706
707
708
709
710
711
712
713
714
715
716
717
718
719
720
721
722
723
724
725
726
727
728
729
730
731
732
733
734
735
736
737
738
739
740
741
742
743
744
745
746
747
748
749
750
751
752
753
754
755
756
757
758
759
760
761
762
763
764
765
766
767
768
769
770
771
772
773
774
775
776
777
778
779
780
781
782
783
784
785
786
787
788
789
790
791
792
793
794
795
796
797
798
799
800
801
802
803
804
805
806
807
808
809
810
811
812
813
814
815
816
817
818
819
820
821
822
823
824
825
826
827
828
829
830
831
832
833
834
835
836
837
838
839
840
841
842
843
844
845
846
847
848
849
850
851
852
853
854
855
856
857
858
859
860
861
862
863
864
865
866
867
868
869
870
871
872
873
874
875
876
877
878
879
880
881
882
883
884
885
886
887
888
889
890
891
892
893
894
895
896
897
898
899
900
901
902
903
904
905
906
907
908
909
910
911
912
913
914
915
916
917
918
919
920
921
922
923
924
925
926
927
928
929
930
931
932
933
934
935
936
937
938
939
940
941
942
943
944
945
946
947
948
949
950
951
952
953
954
955
956
957
958
959
960
961
962
963
964
965
966
967
968
969
970
971
972
973
974
975
976
977
978
979
980
981
982
983
984
985
986
987
988
989
990
991
992
993
994
995
996
997
998
999
1000
#Spatial Data in R
##Sydney Institute of Marine Science 10th August 2015
This work is published under a Creative Commons Attribution-NonCommercial-NoDerivatives 4.0 International License.
<img src="Publication/images/Cc_by-nc-nd_euro_icon.png" style="width: 100px;"/>
##Hello World. Initial Steps
###Set up a project directory
<img src="Publication/images/project_dir_diagram.jpg" style="width: 200px;"/>
###A fun intro
[](http://www.youtube.com/watch?v=rJC7B-9ZfhE)
This exercise is from James Cheshire, a very cool analyst from University College London. His site is spatial.ly. His Population Lines image now hangs in my loungeroom!
<img src="Publication/pop_lines.jpg" style="width: 200px;"/>
This graphic uses ggplot (which we'll get to later...) to simply plot the routes that south England residents too and from work each day.
```{r, eval=FALSE}
###Mapping Journeys to Work in the UK
library(plyr)
library(ggplot2)
library(maptools)
##read in the data- it is a really big dataset! It will take some time to read in
input<-read.table("Data/wu03ew_v1.csv", sep=",", header=T)
##select only the origin, destination and total kms from the data
input<- input[,1:3]
names(input)<- c("origin", "destination","total")
##download and input the population centroids from
centroids <- read.csv("Data/msoa_popweightedcentroids.csv")
or.xy <- merge(input, centroids, by.x="origin", by.y="Code")
names(or.xy) <- c("origin", "destination", "trips", "o_name", "oX", "oY")
dest.xy <- merge(or.xy, centroids, by.x="destination", by.y="Code")
names(dest.xy) <- c("origin", "destination", "trips", "o_name", "oX", "oY","d_name", "dX", "dY")
##plotting in ggplot2
xquiet <- scale_x_continuous("", breaks=NULL)
yquiet <-scale_y_continuous("", breaks=NULL)
quiet <-list(xquiet, yquiet)
ggplot(dest.xy[which(dest.xy$trips>10),], aes(oX, oY))+
geom_segment(aes(x=oX, y=oY,xend=dX, yend=dY, alpha=trips), col="white")+
scale_alpha_continuous(range = c(0.03, 0.3))+
theme(panel.background = element_rect(fill='black',colour='black'))+quiet+coord_equal()
```
###Some preliminaries
#####Installing rgdal on a Mac
*The Easy Way*
In R run: install.packages(‘rgdal’,repos=”http://www.stats.ox.ac.uk/pub/RWin“)
*The Hard Way* If the easy way doesn't work.
Download and install GDAL 1.8 Complete and PROJ framework v4.7.0-2 from: http://www.kyngchaos.com/software/frameworks%29
Download the latest version of rgdal from CRAN. Currently 0.7-1
Run Terminal.app, and in the same directory as rgdal_0.7-1.tar.gz run:
R CMD INSTALL --configure-args='--with-gdal-config=/Library/Frameworks/GDAL.framework/Programs/gdal-config --with-proj-include=/Library/Frameworks/PROJ.framework/Headers --with-proj-lib=/Library/Frameworks/PROJ.framework/unix/lib' rgdal_0.7-1.tar.gz
####Git and GitHub
GitHub is a platform for hosting and collaborating on projects. You don’t have to worry about losing data on your hard drive or managing a project across multiple computers — sync from anywhere. Most importantly, GitHub is a collaborative and asynchronous workflow for building software better, together.
1. Sign Up here. https://github.com/join
2. To create a new repository
-Click the icon next to your username, top-right.
-Name your repository hello-world.
-Write a short description.
-Select Initialize this repository with a README.

3. Navigate to LucasCo/HASpatial. There you will find the the course materials that we will be working from.
4. *Fork* the repo into your own GitHub account.
###A brief primer on R classes
Remember that:
```{r, eval=FALSE}
x <- sum(c(2, 5, 7, 1))
x
```
```
## [1] 15
```
`x` is an object in R. It has a class, which represents the way the data in x is stored.
```{r, eval=FALSE}
class(x)
```
```
## [1] "numeric"
```
we can see that the class of `x` is `numeric`.
Classes determine what actions functions are going to have on the object. These functions, for example, include `print, summary, plot` etc. If no method is avialable for a specific class then it will try and default to known generic methods.
When R was first being created, there were no real functions. They were introduced in 1992 in a form called 'S3' classes, or 'old-style classes'.
Think back to the classic data set shipped with R, `mtcars'.
```{r, eval=FALSE}
data(mtcars)
class(mtcars)
```
```
## [1] "data.frame"
```
```{r, eval=FALSE}
typeof(mtcars)
```
```
## [1] "list"
```
```{r, eval=FALSE}
names(mtcars)
```
```
## [1] "mpg" "cyl" "disp" "hp" "drat" "wt" "qsec" "vs" "am" "gear" "carb"
```
mtcars is a `data.frame` that is stored as a `list` (this is why things like `lapply` will work on `data.frames`).
Old style classes are generally `lists` with attributes and not defined formally. In 1998 new style `S4` style classes were introduced. The main definition between old and new style classes that that the new S4 classes have clear, formal, definitions that can specify the type and storage structure for each of the components, called *slots*.
An understanding of these classes is important, as most spatial data in R uses new style, *S4* classes.
###R and spatial
Different spatial classes in R *inherit* their attributes from other classes.
#### 1. `Spatial class`

```{r, eval=FALSE}
library(sp)
```
```{r, eval=FALSE}
getClass("Spatial")
```
```
#getClass("Spatial")
#Class "Spatial" [package "sp"]
#Slots:
#
#Name: bbox proj4string
#Class: matrix CRS#
#Known Subclasses:
#Class "SpatialPoints", directly
#Class "SpatialMultiPoints", directly
#Class "SpatialGrid", directly
#Class "SpatialLines", directly
#Class "SpatialPolygons", directly
#Class "SpatialPointsDataFrame", by class "SpatialPoints", distance 2
#Class "SpatialPixels", by class "SpatialPoints", distance 2
#Class "SpatialMultiPointsDataFrame", by class "SpatialMultiPoints", distance 2
#Class "SpatialGridDataFrame", by class "SpatialGrid", distance 2
#Class "SpatialLinesDataFrame", by class "SpatialLines", distance 2
#Class "SpatialPixelsDataFrame", by class "SpatialPoints", distance 3
#Class "SpatialPolygonsDataFrame", by class "SpatialPolygons", distance 2
```
```{r}
m <- matrix(c(0, 0, 1, 1), ncol = 2, dimnames = list(NULL, c("min", "max")))
print(m)
```
```
```
```{r}
crs <- CRS(projargs = as.character(NA))
print(crs)
```
```
```
```{r}
S <- Spatial(bbox = m, proj4string = crs)
S
```
```
```
* We first creat a bounding box by making a 2 x 2 matrix.
* Create a CRS object (a specific object defined in the package `sp`). Give it no arguments.
* Create our first `Spatial` object, calling it `S`. We can see it has a `bbox` and a CRS (called a proj4string).
####2. `Spatial Points`

Let's start using some real data!
The data below is from the OpenFlights project. OpenFlights is a tool that lets you map your flights around the world, search and filter them in all sorts of interesting ways, calculate statistics automatically, and share your flights and trips with friends and the entire world (if you wish). It's also the name of the open-source project to build the tool.
They have put their data (and code) on a public GitHub repo. Download and load into R directly.
```{r}
library(RCurl)
URL <- "https://raw.githubusercontent.com/jpatokal/openflights/master/data/airports.dat"
x <- getURL(URL)
airports <- read.csv(textConnection(x), header = F)
```
```{r}
colnames(airports) <- c("ID", "name", "city", "country", "IATA_FAA", "ICAO", "lat", "lon", "altitude", "timezone", "DST",
"TimeZone")
head(airports)
```
The only difference between the `Spatial` and `SpatialPoints` class is the addition of the `coords` *slot*.
```{r, eval=FALSE}
air_coords <- cbind(airports$lon, airports$lat)
air_CRS <- CRS('+proj=longlat +ellps=WGS84')
airports_sp <- SpatialPoints(air_coords, air_CRS)
summary(airports_sp)
```
####Methods
#####Bounding Box
Note that we did not specify a Bounding Box even though it is an integral component of the `Spatial` class. A bounding box is automatically assigned by taking the minimum and maximum latitude and longitude of the data.
```{r}
bbox(airports_sp)
```
#####Projection and datum
All spatial objects have a generic method `proj4string`. This sets the coordinate reference of the associated spatial data. Proj4 strings are a compact, but slightly quirky looking, way of specifying location references. Using the Proj4 syntax, the complete parameters to specify a CRS can be given. For example the PROJ4 string we usually use in Sydney is *+proj=utm +zone=56 +south +ellps=GRS80 +units=m +no_defs*. Here we essentially state that the CRS we are using is UTM (a projected CRS) in Zone 56. Most commonly we can start with an unprojected CRS (simply the longitute and latitude) using the CRS in the code above *+proj=longlat +ellps=WGS84*.
Proj4 strings can be assigned and re-assigned. NOTE that re-assigning a CRS does does NOT transform it. Simply saying the proj=utm will not convert the coordinates from long/lat into UTM.
```{r}
proj4string(airports_sp) <- CRS(as.character(NA))
summary(airports_sp)
```
```{r}
proj4string(airports_sp) <- air_CRS
```
#####Subsetting
Subsetting SpatialPoints can be accomplished in the same manner as most other subsetting in R - using logical vectors.
```{r}
airports_oz <- which(airports$country=='Australia')
head(airports_oz)
```
```{r}
oz_coords <- coordinates(airports_sp)[airports_oz,]
head(oz_coords)
```
```{r, eval=FALSE}
plot(oz_coords)
```
You can also use the subsetting methods directly on the SpatialPoints.
```{r}
summary(airports_sp[airports_oz,])
```
####3. `SpatialPointsDataFrame`

Often we need to associate attribute data to simple point locations. The `SpatialPointsDataFrame` is the container for this sort of data. You can see from the diagram above that the `SpatialPointsDataFrame` object extends the `SpatialPoints` class, and inherits the `bbox`, `proj4string` and `coords` objects.
```{r}
getClass('SpatialPointsDataFrame')
```
So far we have downloaded a `data.frame`, where 2 columns were latitude and longitude, and constructed a simple SpatialPoints object from it.
A `SpatialPointsDataFrame` simply connects the SpatialPoints with the rest of the attribute data.
A key consideration here is that the `row.names` of both the matrix of coordinates and the data need to match.
```{r}
airports_spdf <- SpatialPointsDataFrame(coords=air_coords, data=airports, proj4string=air_CRS)
summary(airports_spdf)
```
We can shorten this by simply joining a `SpatialPoints` objects with the data.
```{r, eval=FALSE}
airports_spdf <- SpatialPointsDataFrame(airports_sp, airports)
```
####4. Lines, Lines, Lines!

Lines are tricky. In the old `S` language they were simply represented by a series of numbers seperated by an `NA` that represented the end of the line. In R the most basic representation of a line is the `Line` object, essentially a matrix of 2-D coordinates. Many of these `Line` objects form the `Lines` slot of a `Lines` object. Other spatial data like a CRS and the bounding box are included in `SpatialLines` objects.
```{r}
getClass('SpatialLines')
```
```{r, fig.width=8, fig.height=6}
library('maps')
library('maptools')
oz <- map('world', 'Australia', plot=FALSE)
oz_crs <- CRS('+proj=longlat +ellps=WGS84')
oz <- map2SpatialLines(oz, proj4string=oz_crs)
str(oz, max.level=2)
```
A common way of accessing (and if you're game, manipulating) `sp` objects is via the `list` style functions `sapply` or `lapply`.
For example to find the length of the Lines slot, or how many `Line` objects it contains we can use the following
```{r}
len <- sapply(slot(oz, 'lines'), function(x) length(slot(x, 'Lines')))
len
```
Lets plot it for funsies. See if you can do it. Hint: just use the `plot()` function.
```{r, eval=FALSE}
plot(oz)
```
#### 5. SpatialPolygons

Lets use the area around Auckland as an example of working with polygon data.
```{r}
auc_crs <- CRS('+proj=longlat +ellps=WGS84')
auc_shore <- MapGen2SL('Data/auckland_mapgen.dat', auc_crs)
summary(auc_shore)
```
Lets have a closer look at the Auckland lines data and see if any of the lines *join* up. i.e Do the begining and end coordinates match.
First lets just check if all the `lines` objects have only one `line` in them.
```{r}
nz_lines <- slot(auc_shore, 'lines')
sapply(nz_lines, function(x) length(slot(x, 'Lines')))
```
So all the lines `objects` in the Auckland dataset consists of only one line. That makes things easier. Let see how many have beginning and end coordinates that match. Don't worry if you don't follow this code.
This is a bit in-depth and you really wouldn't do this in real life, but lets construct some polygon data from our New Zealand lines data.
```{r}
auc_islands <- sapply(nz_lines, function(x){
crds <- slot(slot(x, 'Lines')[[1]], 'coords')
identical(crds[1,], crds[nrow(crds),])
})
table(auc_islands)
```
So we have a bunch of lines that are essentially islands. These can be made into proper polygons.
First look at the structure of the hierarchical nature of polygons. They're much the same as `SpatialLines`.
```{r}
getClass("Polygon")
getClass("Polygons")
getClass("SpatialPolygons")
```
If we take only those `lines` in the Auckland data set that are closed lines we get
```{r}
auc_shore <- auc_shore[auc_islands]
list_of_lines <- slot(auc_shore, 'lines')
islands_sp <- SpatialPolygons(lapply(list_of_lines, function(x) {
Polygons(list(Polygon(slot(slot(x, "Lines")[[1]], "coords"))),
ID=slot(x, "ID"))
}), proj4string=CRS("+proj=longlat +ellps=WGS84"))
summary(islands_sp)
getClass('SpatialPolygons')
slot(islands_sp, "plotOrder")
```
The key points know for Polygon data (and indeed for most Spatial data in R) is:
1. *data*: This holds the data.frame
2. *polygons*: This holds the coordinates of the polygons
3. *plotOrder*: The order that the coordinates should be drawn
4. *bbox*: The coordinates of the bounding box (edges of the shape file)
5. *proj4string*: A character string describing the projection system
##Visualising Spatial Data
[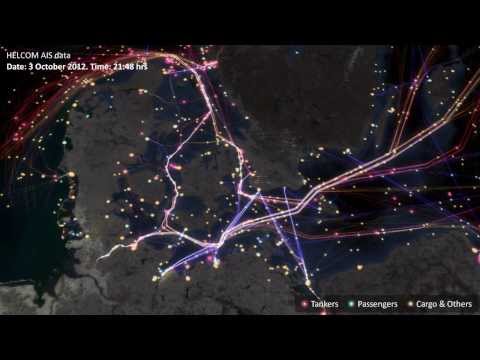](http://www.youtube.com/watch?v=X9UtUzHDn4c)
####Let's start basic.
```{r}
##basic intro
data(meuse)
str(meuse)
coordinates(meuse) <- c('x', 'y')
str(meuse)
```
```{r, fig.width=6, fig.heigt=6}
plot(meuse)
data(meuse.riv)
Polygon(meuse.riv)
meuse_lst <-list(Polygons(list(Polygon(meuse.riv)), "meuse.riv"))
meuse_sp <- SpatialPolygons(meuse_lst)
plot(meuse_sp, axes=F)
plot(meuse, add=T, pch=16, cex=0.5)
```
Try adding axes by using the `axes=T` argument.
Note that R has reserved the space that would have been taken up by the axes, even though they aren't plotted. Using the `par` command we can change many graphical parameters. It's good practice to save the `default` par arguments.
```{r, eval=FALSE}
##par arguements
oldpar = par(no.readonly = TRUE)
layout(matrix(c(1,2),1,2))
plot(meuse, axes = TRUE, cex = 0.6)
title("Sample locations")
par(mar=c(0,0,0,0)+.1)
plot(meuse, axes = FALSE, cex = 0.6)
box()
par(oldpar)
```
##Excercises
1. In the data folder you'll find a list of all airports in the world. Read in that data, subset to all airports in Canada. Create a SpatialPointsDataFrame of this data and create a nice plot of all Canadian airports.
*note* In the Data folder you will find a *Shapefile* of the Canadian coastline. We haven't covered this yet, but you can input, and plot this shapefile using the following code:
```{r, eval=FALSE}
install.packages('rgdal')
library(rgdal) ##we will cover this in the following section
can_border <- readOGR(dsn='Data', layer='Canada')
can_border <- spTransform(can_border, CRS('+proj=longlat +ellps=WGS84'))
plot(can_border)
```
####rgdal and importing other spatial data types
The GDAL (Geospatial Data Abstraction Library) is a library for reading and writing raster geospatial data formats, and is released under the permissive X/MIT style free software license by the Open Source Geospatial Foundation. As a library, it presents a single abstract data model to the calling application for all supported formats. It may also be built with a variety of useful command-line utilities for data translation and processing.
Calls to the GDAL framework are made using the r package `rgdal`. You should now have this on your computer. Hopefully it didn't cause too much trouble!
The main reason this package is so important for working scientists and analysts, is that it allows the import and export of the common ESRI data, shapefiles.
```{r, eval=FALSE}
install.packages('rgdal')
library('rgdal')
```
*Reef Life Survey*
RLS consists of a network of trained, committed recreational SCUBA divers, and an Advisory Committee made up of managers and scientists with direct needs for the data collected, and recreational diver representatives.
The RLS diver network undertakes scientific assessment of reef habitats using visual census methods, through a combination of targeted survey expeditions organised at priority locations under the direction of the Advisory Committee, and through the regular survey diving activity of trained divers in their local waters.
Here is a subset of there data available from the Integrated Marine Observing System, accessed here https://imos.aodn.org.au/imos123/home.
Lets read it in and then map their Sydney sites. I have exported raw data and converted to an ESRI Shapefile for use in most GIS.
The key component of reading in Shapefile data is to use the `readOGR` function. Note that several other methods exists, but the readOGR, from the rgdal package is most reliable and useful.
```{r, fig.width=6, fig.height=6}
rls <- readOGR(dsn='Data', layer='rls_sites_sydney')
summary(rls)
plot(rls, pch=16)
```
lets also bring in a Sydney Harbour shoreline layer, also as an ESRI Shapefile.
```{r}
syd <- readOGR(dsn='Data', layer='SH_est_poly_utm')
```
The Sydney shoreline files are simply in Longitude and Latitude (using the WGS84 representation of the Earth). Lets change this CRS to represent a local projection commonly used here in New South Wales. It is simply the Universal Transverse Mercator.
The Universal Transverse Mercator (UTM) conformal projection uses a 2-dimensional Cartesian coordinate system to give locations on the surface of the Earth. Like the traditional method of latitude and longitude, it is a horizontal position representation, i.e. it is used to identify locations on the Earth independently of vertical position. However, it differs from that method in several respects.
The UTM system divides the Earth between 80°S and 84°N latitude into 60 zones, each 6° of longitude in width. Zone 1 covers longitude 180° to 174° W; zone numbering increases eastward to zone 60 that covers longitude 174 to 180 East.
The `spTransorm` function within `rgdal` can *project* our lat/lon CRS into the correct UTM zone. Here in Sydney, the UTM zone is 56.
```{r}
syd <- spTransform(syd, CRS('+proj=utm +zone=56 +south +ellps=WGS84 +units=m +no_defs'))
```
note the rls data is already projected, and this projection is brought into R from the dbf file of the ESRI data suite.
Lets plot this out nicely.
```{r, fig.width=6, fig.height=6}
plot(syd, axes=F, col='grey')
plot(rls, pch=16, col='dodgerblue',add=T)
title('Reef Life Survey Sites - Sydney Area', line=0.5)
##add scale bar and
#install.packages('GISTools')
#library(GISTools)
map.scale(xc= 325000, yc= 6250000, len=2000, ndivs=2, units='km')
north.arrow(xb= 325000, yb= 6258000, len=100)
```
[](http://www.youtube.com/watch?v=qGllzWt0acU)
##Two common spatial manipulations
####Point in Polygon Operations
The figure produced above has points that fall outside the actual Harbour. We can do a Point in Polygon operation to remove these points.
```{r, fig.width=6, fig.height=6}
syd_pol <- as(syd, "SpatialPolygons")
over(rls, syd_pol) #which sites are 'over' the polygon. Creates
!is.na(over(rls, as(syd, "SpatialPolygons")))
inside_harb <- is.na(over(rls, syd_pol))
rls_harb <- rls[!inside_harb, ]
summary(rls_harb)
plot(syd, col='lightgrey')
plot(rls_harb, col='dodgerblue', add=T, pch=18)
title('Reef Life Survey Sites - Sydney Harbour only', line=0.5)
map.scale(xc= 325000, yc= 6250000, len=2000, ndivs=2, units='kms')
north.arrow(xb= 325000, yb= 6258000, len=100)
```
####Spatial Polygon Dissolves
Sometimes there is a need to dissolve smaller polygons into larger ones. Think, for example, about having a Spatial Polygon dataset of Postal codes that you need to aggregate up into states. We'll work with a dataset that notes the participation in school sport across areas of the greater London metro area. Pretend there is a need to aggregate this shapefile simply into the area of greater London.
```{r, fig.height=6, fig.width=6}
london_sport <- readOGR(dsn="Data", layer="london_sport")
plot(london_sport)
proj4string(london_sport) <- CRS("+init=epsg:27700")
london_sport$london <- rep(1, length(london_sport))
london <- unionSpatialPolygons(london_sport, IDs=london_sport$london)
plot(london)
```
###Exercise Two
1. There are a bunch of cool spatial methods that can improve the efficiency of your work.
One of them is random spatial sampling. Say you need to randomly position sampling sites across an area. The most basic way of choosing these sites might make use of `spsample`. Use the help file on `spsample` to pick, and then map, 40 Fish traps to be deployed into Sydney Harbour every year. Your boss wants a single map, with colour coded symbols denoting which of the three years the fish traps will be deployed i.e. three colours on the map.
###Publication ready mapping
We wouldn't really use the base plotting function for anything other than basic maps. We tend to use the very powerful `ggplot2` package by Hadley Wickham.
Lets work with the London Sport Participation dataset to start.
```{r}
##To get the shapefiles into a
##format that can be plotted we have to use the fortify() function.
##he “polygons” slot contains the geometry of the polygons in the form
##of the XY coordinates used to draw the polygon outline. While ggplot is good,
##there is still no way for it to work out what is going on there. i.e. we need to convert
##this geometry into a `normal` data.frame.
sport.f <- fortify(london_sport, region = "ons_label")
head(sport.f)
##need to merge back in the attribute data
sport.f <- merge(sport.f, london_sport@data, by.x = "id", by.y = "ons_label")
head(sport.f)
Map <- ggplot(sport.f, aes(long, lat, group = group, fill = Partic_Per)) +
geom_polygon() +
coord_equal() +
labs(x = "Easting (m)", y = "Northing (m)", fill = "% Sport Partic.") +
ggtitle("London Sports Participation")
Map
##and if we wanted black and white for publication
Map + scale_fill_gradient(low = "white", high = "black")
```
Remember faceting? Well that can be done with maps as well using ggplot. We need to use a function called `melt` and `reshape` to get the data in the right form though.
```{r, fig.width=7, fig.height=7}
###faceting maps - courtesy of James Cheshire and spatial.ly
library(reshape2)
london.data <- read.csv("Data/census-historic-population-borough.csv")
head(london.data)
london.data.melt <- melt(london.data, id = c("Area.Code", "Area.Name"))
london.data.melt[1:50,]
##remember what sport.f id was! How cool, now we can merge these data.
head(sport.f)
plot.data <- merge(sport.f, london.data.melt, by.x = "id", by.y = "Area.Code")
head(plot.data)
##order so plots are sensible i.e. in time order
plot.data <- plot.data[order(plot.data$order), ]
head(plot.data)
##now simply facet them in the usual ggplot way!
ggplot(data = plot.data, aes(x = long, y = lat, fill = value, group = group)) +
geom_polygon() + geom_path(colour = "grey", lwd = 0.1) + coord_equal() +
facet_wrap(~variable)
```
[](http://www.youtube.com/watch?v=6pI77r3oAxw)
Now go back to the start of the workbook, and try and make sense of the London Commute map code.
Exercises Three
1. In the data folder there is a file called `cts_srr_04_2015_pt`. This is the Automatic Identification System data for all ships entering Australian waters for the month of April this year. Also in the folder, you will find a rectangular shapefile that covers the south east coast of Australia. Subset the AIS data to the South East coast of Australia. Plot this data in a nice graph (preferably using GGPLOT2). See if you can find the outline of Australia somewhere on the internet (obviously as a shapefile) and plot this too.
## Working with Rasters
### Let's get set up first
Check if you can see the data - your working directory should be this file's location, and your data should be in Data/
```{r, eval=FALSE}
file.exists("Data/Cairns_Mangroves_30m.tif")
file.exists("Data/SST_feb_2013.img")
file.exists("Data/SST_feb_mean.img")
```
You should also have a folder Output/ for when we export results
Install the packages we're going to need - raster for raster objects, dismo is SDM, rgdal to read and write various spatial data
```{r, eval=FALSE}
install.packages(c('raster', 'dismo','rgdal', 'gstat'))
```
Check that you can load them
```{r, eval=FALSE}
library(raster)
library(dismo)
library(rgdal)
```
### What is a raster?
Now we're ready to go, but firstly, what is a raster? Well, simply, it is a grid of coordinates for which we can define a value at certain coordinate locations, and we display the corresponding grid elements according to those values. The raster data is essentially a matrix, but a raster is special in that we define what shape and how big each grid element is, and usually where the grid should sit in some known space (i.e. a geographic projected coordinate system).

### Understanding Raster Data
Make a raster object, and query it
```{r, eval=FALSE}
x <- raster(ncol = 10, nrow = 10) # let's make a small raster
nrow(x) # number of pixels
ncol(x) # number of pixels
ncell(x) # total number of pixels
plot(x) # doesn't plot because the raster is empty
hasValues(x) # can check whether your raster has data
values(x) <- 1 # give the raster a pixel value - in this case 1
plot(x) # entire raster has a pixel value of 1
```
Make a random number raster so we can see what's happening a little easier
```{r, eval=FALSE}
values(x) <- runif(ncell(x)) # each pixel is assigned a random number
plot(x) # raster now has pixels with random numbers
values(x) <- runif(ncell(x))
plot(x)
x[1,1] # we can query rasters (and subset the maaxtrix values) using standard R indexing
x[1,]
x[,1]
```
Use this to interactively query the raster - press esc to exit
```{r, eval=FALSE}
click(x)
```
What's special about a raster object?
```{r, eval=FALSE}
str(x) # note the CRS and extent, plus plenty of other slots
crs(x) # check what coordinate system it is in, the default in the PROJ.4 format
xmax(x) # check extent
xmin(x)
ymax(x)
ymin(x)
extent(x) # easier to use extent
res(x) # resolution
xres(x) # just pixel width
yres(x) # just pixel height
```
#### Excercises
* make a raster with a smiley face
* extract some vector and matrix data from the raster
* subset the raster into a smaller chunk (tricker - see ```?"raster-package"```)
### Working with real raster data
Import the Cairns mangrove data and have a look at it
```{r, eval=FALSE}
mangrove <- raster("Data/Cairns_Mangroves_30m.tif")
crs(mangrove) # get projection
plot(mangrove, col = topo.colors("2")) # note two pixel values, 0 (not mangrove) and 1 (mangrove)
NAvalue(mangrove) <- 0 # make a single binary dataset with mangroves having a raster value 1
plot(mangrove, col = "mediumseagreen")
```
The legend is a little odd - we can change to a categorical legend by doign this - but we'll stick to the default continous bar generally so as to reduce clutter in the code
```{r, eval=FALSE}
cols <- c("white","red")
plot(mangrove, col=cols, legend=F)
legend(x='bottomleft', legend=c("no mangrove", "mangrove"), fill=cols)
```
Simple processing
```{r, eval=FALSE}
agg.mangrove <- aggregate(mangrove, fact=10) # aggregate/resample cells (10 times bigger)
par(mfrow=c(2,2))
plot(mangrove, col = "mediumseagreen")
plot(agg.mangrove, col = "firebrick")
plot(agg.mangrove, col = "firebrick")
plot(mangrove, col = "mediumseagreen", add=TRUE) # add information to current plot
```
Create a simple buffer
```{r, eval=FALSE}
buf.mangrove <- buffer(agg.mangrove, width=1000) # add a buffer
par(mfrow=c(1,1))
plot(buf.mangrove, col = "peachpuff")
plot(mangrove, col = "mediumseagreen", add = T) # note add= argument
```
Convert raster to point data, and then import point data as raster
```{r, eval=FALSE}
pts.mangrove <- rasterToPoints(mangrove)
str(pts.mangrove)
par(mfrow=c(2,2))
plot(mangrove)
plot(rasterFromXYZ(pts.mangrove)) # huh?
NAvalue(mangrove) <- -999
pts.mangrove <- rasterToPoints(mangrove)
plot(rasterFromXYZ(pts.mangrove))
NAvalue(mangrove) <- 0 # set it back to 0
par(mfrow=c(1,1))
```
Export your data - lets try the aggregated raster
```{r, eval=FALSE}
KML(agg.mangrove, "Output/agg.mangrove.kml", overwrite = TRUE)
writeRaster(agg.mangrove, "Output/agg.mangrove.tif", format = "GTiff")
```
Hang on, what about multiband rasters? The raster package handles them in the same way, just the ```nbands()``` attribute is >1 - think about an array instead of a matrix
```{r, eval=FALSE}
multiband <- raster("Data/multiband.tif")
nbands(multiband)
nrow(multiband)
ncol(multiband)
ncell(multiband)
```
What about making our own multiband raster?
```{r, eval=FALSE}
for (i in 1:4) { assign(x=paste0("band",i), value=raster(ncol=10,nrow=10))}
values(band1) <- runif(100); values(band2) <- runif(100); values(band3) <- runif(100); values(band4) <- runif(100)
multiband.stack <- stack(list(band1,band2,band3,band4))
nlayers(multiband.stack)
plot(multiband.stack)
```
Plotting an RGB image?
```{r, eval=FALSE}
plotRGB(multiband.stack, r=1, g=2, b=3)
range(multiband.stack)
plotRGB(multiband.stack, r=1, g=2, b=3, scale=1) # let it know what the max value is for display
plotRGB(multiband.stack, r=3, g=2, b=1, scale=1)
plotRGB(multiband.stack, r=2, g=3, b=4, scale=1)
```
Other handy processing functions
```{r, eval=FALSE}
?crop
?merge
?trim
?interpolate
?reclassify
?rasterToPolygons
```
Some handy analysis functions
```{r, eval=FALSE}
?zonal # zonal statistics
?focal # moving windows
?calc # raster calculator
?distance # distance calculations
?sampleRandom
?sampleRegular
?sampleStratified
```
We won't go into detail on coordinate and projection systems today, but *very* briefly, remembering ```CRS()``` objects from the earlier sessions
```{r, eval=FALSE}
crs(mangrove)
proj4string(mangrove)
latlong <- "+init=epsg:4326"
CRS(latlong)
eastnorth <- "+init=epsg:3857"
CRS(eastnorth)
latlongs.mangrove <- rasterToPoints(mangrove, spatial=T)
latlongs.mangrove
projected.pts.mangrove <- spTransform(latlongs.mangrove, CRS(eastnorth))
projected.pts.mangrove
```
#### Excercises
* import the raster "Landsat_TIR.tif" - it's a TIR (thermal infrared) image from the Landsat 8 satellite captured over a cropping area
* suppose we modelled the TIR values via linear regression to calculate the real on ground temperature, and beta0 was 0.5 and beta1 was 0.1 (i.e. y = 0.1x + 0.5) - make a map of temperature (hint: ```?calc```, and you'll need to write a function)
* give the plot a title and axis labels, and colours that make sense for temperature
* make a matching raster (in extent and number of pixels, for the easiest solution) with zone codes (for each pixel), then calulate the mean/sd temperature in those zones (hint: ```?values``` and ```?zonal```)
### Extending raster analyses
Now let's take a bit of a whirlwind tour of the types of analyses we can do, and hopefully discover a bit deeper understanding of raster analysis in R.