
 <img
<img 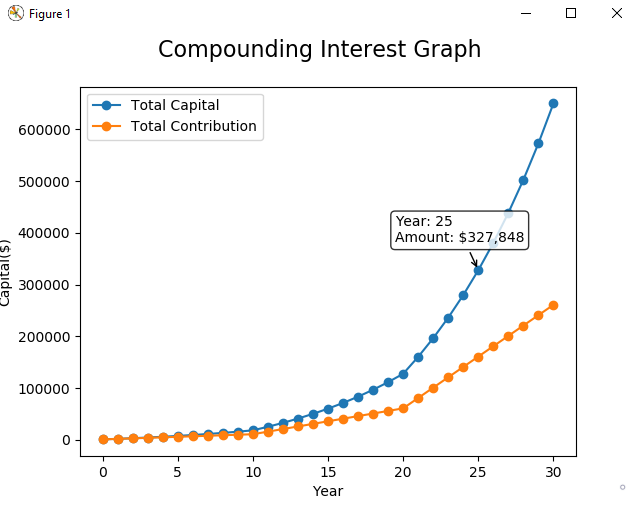
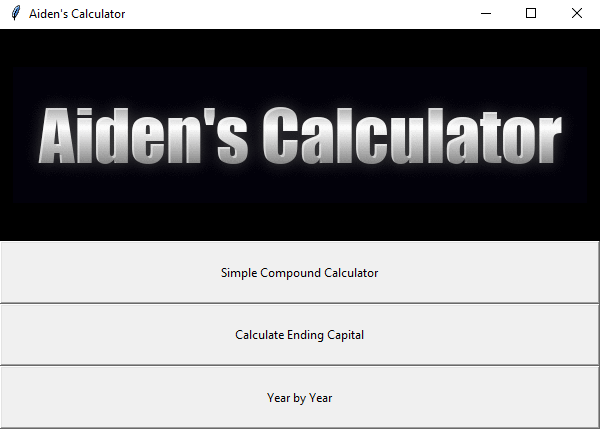
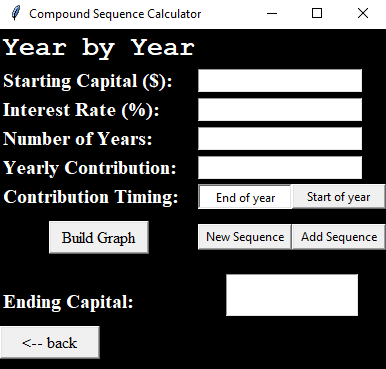
Calculate future savings with: capital, rate, years, yearly contribution.
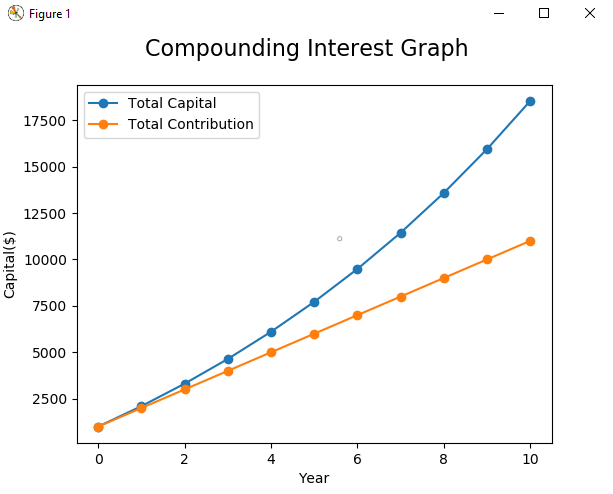
Build annotated graphs to see the difference between contributions and interest.
Download all files as a ZIP.
Extract files into the same folder.
Ensure python and Tkinter are installed.
Run calculator.py
Use of multiple scripts for one program.
Ability to compartmentalise my code into functions and classes.
Following some PEP8 guidelines to improve readability of my code.
Tkinter functionality of: labels, buttons, radiobuttons, windows, entry boxes, output boxes, grid system.
Integrated script I modified into the program.
Matplotlib for building and showing graphs.
Hovering annotations for line graphs.
Add graphs for visual representation.
Year by year movement.
Calculate interest rates and years.
Shift between light/dark theme.
Graph drawing script can be found here:
https://github.com/AidenBurgess/MultiAnnotationLineGraph