
This repository stores code for the compilation of analysis-ready point data with the purpose of characterizing time-series of traffic related air pollution using mobile monitoring using Google Air Vehicle.
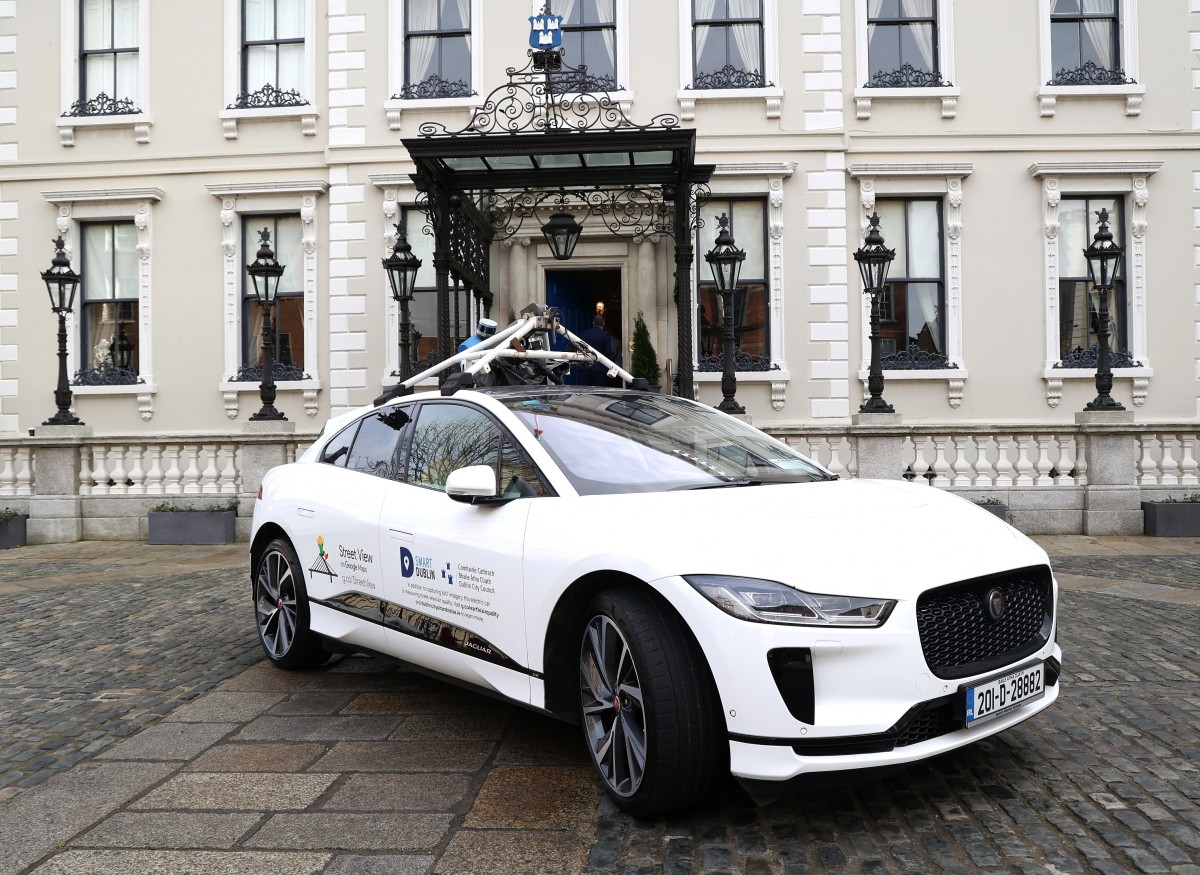

The monitored variables (1Hz) including gas (CO, NO2, O3, nitrogen monoxide (NO), carbon dioxide (CO2)) and fine particulate matter (e.g., PM2.5).
Data processing for this project was executed using the R progamming language. The result is reproducible if one obtains code and input data.
To run this pipeline, it is highly recommend using latest R version and the following main R libraries will be needed for the pipeline:
- dplyr
- tidyverse
- tidyquant
- lubrida
- zoo
- ggplot2
- ggplottimeseries
- ggpubr
- data.table
- tibble
- corrplot
- Hmisc
- ggcorrplot
Using R to plot map
- sf
- sp
- rgdal
- raster
- rgeos
- maptools
- osmdata
- classInt
- RColorBrewer
- ggmap
- tmap
- maps
- gripExtra
- geosphere
- spdep
- gmapsdistance
- rnaturalearth
- rnaturalearthdata
The final outputs consist of findings on background and local contributions and traffic-related pollutant hotspots in Dublin, Ireland. The associated results include:
-
Time series of hourly a) PM2.5, b) CO, c) NO2, d) CO2, and e) O3 from Google Air View vehicle during May 2021 and May 2022 in Dublin city. Hourly median concentrations on each day were used for calculation, except the O3 hourly maximum was utilized for calculation.
-
Diurnal trends (left) and heatmap (right) of a PM2.5, b NO2, c O3, d CO, and e CO2 by Google Air View vehicle in Dublin city (n = 1486 h).
-
Time series decomposition of background and local contribution for PM2.5 and NO2.
Notes: a and b refer to short-lived events for PM2.5 and NO2 (i.e., 1 h), and c and d refer to longer-lived events for PM2.5 and NO2 (i.e., ~ 8 h)
-
Optimized hotspots analysis for PM2.5 and NO2


If you have any feedback, please reach out to us at chenxcui@gmail.com/ jiayao.chen@ucd.ie