feat(web): draw your PV arrays on the map - #826
Conversation


Typing tilt, azimuth and kWp for a roof you can see out of the window is
the worst part of setting FTW up, and the numbers people type are guesses.
The Weather tab's existing Leaflet map now takes a rectangle drawn over
the panels and turns it into a weather.pv_arrays entry.

The rectangle is angled rather than square to north, because the angle is
where the answer lives: its long edge follows the ridge, and the face is
perpendicular to that. Two directions are perpendicular to a ridge and an
overhead outline genuinely does not say which, so the equatorward one is
offered as a default with a one-click flip, never as a measurement.

Tilt cannot be seen from above at all, so it is typed once before drawing
-- and it is also what converts the outline into panel area. What you
trace on a map is the horizontal projection of a sloped rectangle, so a
35 deg roof carries about 22% more panel than its outline suggests;
without that division every drawn array would be quietly under-sized.
Capacity uses the same 0.70 packing factor and 200 W/m2 module density as
the Lantmateriet roof model, so a drawn array and a derived one compare.

The geometry is a pure ES module, tested against fixtures built from the
standard ellipsoidal metres-per-degree series rather than from its own
spherical projection -- a shape round-tripped through the code under test
would have agreed with itself and proved nothing.

Terra Draw and its Leaflet adapter (both MIT) ship UMD builds, so they
lazy-load behind real SRI hashes instead of the bare version pinning an
ES module would have forced. The adapter captures window.leaflet as it
evaluates while Leaflet only ever defines window.L, so that alias is
load-bearing rather than tidiness. If either bundle fails to load, the
numeric editor is untouched and the page says so.

Co-authored-by: HuggeK <48095810+HuggeK@users.noreply.github.com>
Signed-off-by: Hugo Karlsson <48095810+HuggeK@users.noreply.github.com>

The MapLibre port this PR will need is worked out and verifiedThe roofmodel stack (#734–#736) replaces the Weather tab's Leaflet picker with MapLibre GL, so whichever of us lands second, this PR's drawing glue has to swap adapters. That port now exists and has been driven in a browser on a combined build: branch The swap is smaller than the original integration, because the MapLibre adapter is better-behaved than the Leaflet one:
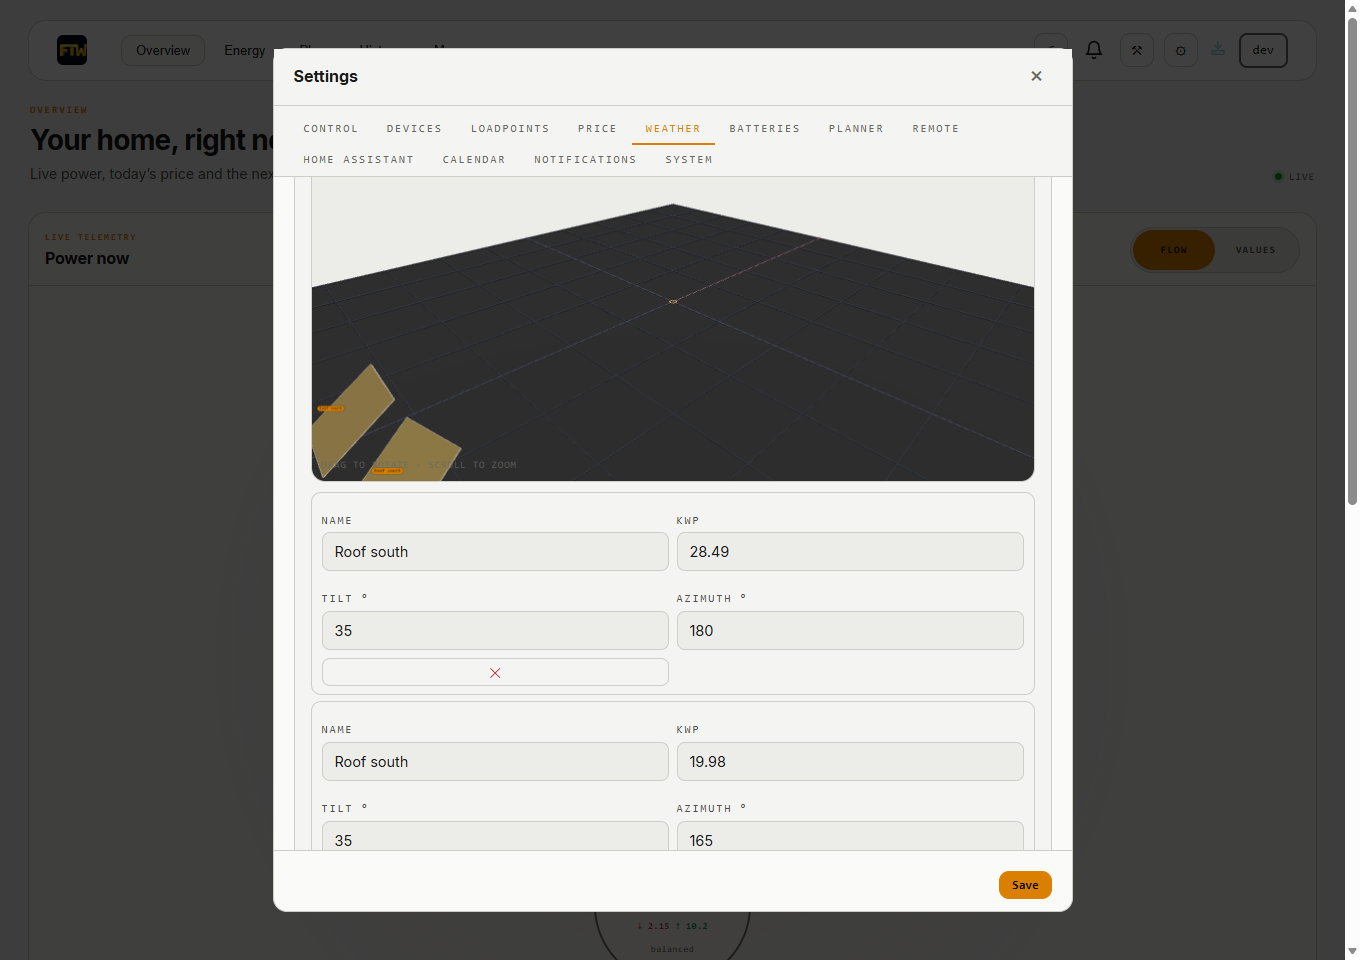
Everything above the adapter — the geometry module, its 21 tests, the finish handler, the flip — merges unchanged: Terra Draw's API is adapter-agnostic at that line. Seen running on the combined build — Read roof from LiDAR filled the first array, then three clicks on the same MapLibre map drew the second:
The editor ends up holding both: the LiDAR-derived Roof south 28.49 kWp @ 180° and the drawn Roof south 19.98 kWp @ 165° (116.9 m² outline → 142.7 m² at 35°, still exactly 1/cos 35°), both rendered in the 3D preview. |

2 participants


Typing tilt, azimuth and kWp for a roof you can see out of the window is the worst part of setting FTW up — and the numbers people type are guesses. The Weather tab's existing Leaflet map now takes a rectangle drawn over the panels and turns it into a
weather.pv_arraysentry.This is phase 5-manual from the roadmap in discussion #717, the one item there with no gating: it needs no Geotorget account, no LiDAR and no roof module.
What drawing can and cannot tell you
A drawn rectangle answers two of the three questions an array asks, and is honest about the third.
The rectangle is drawn at an angle rather than square to north, because the angle is where the answer lives: the long edge follows the ridge, and the face is perpendicular to it.
Why the azimuth is offered rather than asserted
Two directions are perpendicular to a ridge, and a flat outline genuinely does not say which one the panels face. The equatorward candidate is filled in as a default and both candidates are shown, with a one-click flip. Calling that a measurement would be inventing information the drawing does not contain.
The detail that would otherwise under-size every array
What you trace on a map is the horizontal projection of a sloped rectangle, not the rectangle. A sloped area
Acasts a shadow ofA·cos(tilt), so recovering the real panel area divides that back out — a 35° roof carries about 22 % more panel than its outline suggests.That is also why tilt is typed before drawing rather than after: it is an input to the area, not a label on it. Capacity then uses the same 0.70 packing factor and 200 W/m² module density as the Lantmäteriet roof model, so a drawn array and a derived one are directly comparable.
Testing
The geometry is a pure ES module (
web/components/pv-array-geometry.js) with 21 tests.Why the fixtures are not built with the module's own projection
Round-tripping a shape through the code under test would make it agree with itself and prove nothing. The fixtures are built from the standard ellipsoidal metres-per-degree series, deliberately a different model from the module's spherical tangent plane. The two disagree by ~0.5 % in area at Stockholm's latitude — the known bias of a spherical Earth against WGS84, and far below the precision anyone draws a roof with — so the tolerances document that gap instead of hiding it.
Covered: area against a known 10 × 6 m rectangle, winding-order and closing-vertex independence, ridge bearing as a line rather than an arrow, both azimuth candidates, hemisphere-dependent defaults, rotation, the flip, the plan→slope conversion, and that the object written back carries only the four fields
weather.pv_arraysdefines.Dependencies
Terra Draw 1.32.2 and its Leaflet adapter 1.3.0, both MIT, lazy-loaded from CDN only when the tool is first used — the same pattern as today's Leaflet loader, and no new install on the host.
Why UMD, and one load-bearing alias
Both packages ship UMD builds, so they load behind real SRI hashes. That is strictly better than the ES-module route, where SRI does not propagate into a module's own imports and version pinning is all you get.
One trap, found by reading the adapter bundle rather than assuming: its UMD factory captures
window.leafletas it evaluates and uses it for its own vertex markers (a.default.divIcon,a.default.marker), while Leaflet only ever defineswindow.L. Without the alias the adapter loads fine and then throws on the first vertex. The alias is load-bearing, not tidiness.Verification
node --test web/**/*.test.mjs→ 316 tests, 315 pass; the one failure istheme-tokens.test.mjs, which fails identically on a cleanmasteron Windows (path separators).Browser-verified since: the full interaction has now been driven in headless Edge over CDP against a running FTW — both bundles loaded from CDN with their SRI hashes, an angled rectangle drawn with three clicks over the OSM map at zoom 18, the
finishevent fired, and the status line reported “Roof south added: 618.9 m² outline is 755.5 m² of roof at 35°, about 105.77 kWp. Facing 168° — the outline fits 168° and 348° equally well.” (755.5/618.9 = 1/cos 35°.) The array appeared in the numeric editor and the 3D preview, and the flip button turned it to 348° with the form following. Thewindow.leafletalias was exercised live — vertex markers drew without a throw.🤖 Generated with Claude Code
Seen running
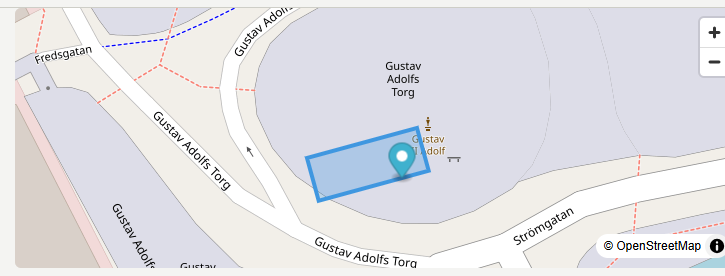
Three clicks over the live OSM map — corner, along the ridge, out to depth — in headless Edge, with both UMD bundles loading from CDN behind their SRI hashes:
The rectangle became a form entry — 105.77 kWp, 35°, 168° — with the 3D preview rendering the plane. 618.9 m² of outline is 755.5 m² of roof: exactly 1/cos 35°.
One click on Flip 180° turned it to 348° and the form followed:
Runbook: how this was demoed (reproducible)
go build -o ftw-draw.exe ./cmd/ftwfrom this branch.provider: open_meteo, no drivers needed for the Weather tab.window._weatherMap.setView(...), press ✎ Draw on the map.Input.dispatchMouseEventat viewport coordinates; screenshots are unretouched viewport captures. Nothing installed.